
Healthcare Policy
Abstract
Medical wait time is a top health policy issue in Canada. Reliable data on the referral wait time from primary to specialty care are limited. Existing data on referral wait times are generally self-reported by specialists. In 2008, the Edmonton North Primary Care Network (PCN) developed a Centralized Referral Program, including a specialist database that contains information on specialists' referral requirements, forms and protocols, and has the capability of tracking referrals that the PCN makes on behalf of its family physicians to specialty care. We performed a trend analysis of the referral wait time (defined as the time from referral by a family physician to an appointment date with a specialist) from 2009 to 2011 using the program database (n=33,281 referrals). The study provided a unique and comprehensive picture of wait times for 22 specialties. We identified a decrease in the overall wait time year over year, and improvement in the number of referrals that are accepted the first time. Additionally, specific opportunities for further improvement in referral wait time were noted.
Referral wait time refers to the wait time from referral by a family physician (FP) to appointment/consultation with a specialist. According to Barua and colleagues (2010), the median referral wait time in Canada, across 12 specialties (plastic surgery, gynaecology, ophthalmology, otolaryngology, general surgery, neurosurgery, orthopaedic surgery, cardiovascular surgery, urology, internal medicine, radiation oncology and medical oncology) and 10 provinces surveyed was 8.9 weeks in 2010. The referral wait time varies greatly by province, with the shortest being reported in Saskatchewan (6.7 weeks) and the longest in New Brunswick (24.6 weeks). In Alberta, the median wait time was 9.9 weeks (or 69.3 days), and reducing wait times is one of the priorities identified in Alberta's Five-Year Health Action Plan (established by the Government of Alberta and Alberta Health Services in 2010).
A primary care network (PCN) is an independent, stand-alone organization jointly owned by a group of FPs practising in a geographic area and Alberta Health Services. Formed by a trilateral agreement in 2003 among the Alberta Medical Association, Alberta Health and Alberta Health Services, Alberta's 40 PCNs are tasked with achieving five provincial objectives that include, among others, increasing the number of Albertans with access to primary care services and improving coordination of primary health services with other healthcare services including hospitals, long-term care and specialty care services (Primary Care Initiative 2012).
Edmonton North PCN, started in 2007, is one of the largest PCNs in the province both in terms of number of patients and number of member FPs. It is made up of 140 FPs working in over 45 clinics providing care to over 150,000 patients. The PCN employs over 90 staff to support the FPs in delivering primary care.
From its inception, improving links with specialists and reducing the referral wait time from family practice to specialty care has been a key priority for this PCN. The Centralized Referral Program, developed in 2008, maintains a customized specialist database with capacity for two data sets. The first involves a comprehensive list of over 800 specialists in and around Edmonton, including their referral requirements, forms and protocols. The second data set contains tracking information on the referrals the PCN makes on behalf of its participating FPs to specialists.
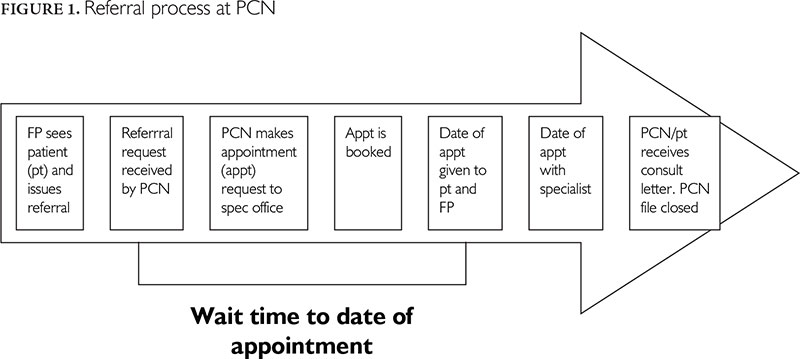
There are 6.8 full-time equivalent (FTE) coordinators who process referrals at the Edmonton North PCN. (Of note, PCN staff do not process urgent referrals as these are made directly by the FP.) The referral process involves seven milestones as shown in Figure 1. After receiving a referral request from the FP, PCN staff make an appointment request to the specialist office. If the referral is accepted by a specialist, the date of booking and date of appointment are noted. If a referral is declined, PCN staff continue to seek an appointment from subsequent specialists until an appointment is received. The advantages of the program are twofold in improving wait time. By tracking the wait time for each specialist, staff can refer patients to the one with the shortest wait list (unless the FP requests a certain specialist). Furthermore, PCN staff ensure that all forms and labs are completed and do relevant investigations to improve the quality and appropriateness of each referral, thus increasing the likelihood that the referral is accepted the first time.
Anecdotal feedback on the program has been positive, and some other PCNs in the province are now using the Edmonton North PCN database; however, the impact of the Centralized Referral Program and its database has never been quantitatively reviewed. Partly to fill this gap, given the unavailability of both control data and baseline data, we performed a trend analysis of the referral wait time from 2009 to 2011 using data from the Edmonton North PCN database.
Methods
Because the referral wait time was calculated from the date of referral received by the PCN to the date of appointment with a specialist, referrals that had not yet received an appointment date were excluded from the study. We used both univariate and multivariate statistical techniques for describing and analyzing the referral wait time among referrals with an appointment date, in terms of mean, median, percentile 90% and percentage of referrals with a wait time of less than or equal to three months – a cut-off that was previously used by Carrière and Sanmartin (2010).
The univariate analysis was undertaken to describe the referral wait time by year (2009, 2010 and 2011) and by characteristics of patients (age and sex) and characteristics of referrals (seasons, referral modes, re-referrals and specialties). The multivariate analysis was used to compare the wait time in 2010 and 2011 to that of 2009, controlling for potential confounders, which were the characteristics of patients and the characteristics of referrals. We used a multiple linear regression for the mean, a multiple quantile regression for the median and for the percentile 90% (Hao and Naiman 2007), and a multiple logistic regression for the percentage of referrals with a wait time of less than or equal to three months.
In this study, male and female patients were categorized into three age groups representing children (0–18 years old), adults (19–64 years old) and seniors (65 years or older).
We grouped referrals with a referral date between February and April as spring, between May and July as summer, between August and October as fall, and between November and January as winter. Referral modes included telephone (where specialists accept referrals by telephone) or letter (where specialists do not make appointments over the telephone but first require a faxed letter). Re-referrals represented instances when a first referral is declined by the specialist, necessitating a subsequent referral to another specialist. Reasons for specialists' declining referrals included not accepting new patients, not assessing or treating the problem listed in the referral, failure to receive required laboratory findings, or the patient's having previously seen another doctor in the same specialty (and who thus should be referred back to that physician). Specialties refer to the medical specialties to which the patients were referred. We included 22 specialties and one "other" category, which comprised a number of specialties having a small number of referrals (this combination was for increasing the statistical power); all are listed in Table 3.
| TABLE 3. Referral wait time (days) by year and specialties | |||||
| Specialties | Year | ||||
| Measures | 2009 | 2010 | 2011 | Total | |
| Allergy & Clinical Immunology | n | 328 | 456 | 225 | 1,009 |
| Mean | 79 | 107 | 181 | 114 | |
| Median | 48 | 98 | 180 | 87 | |
| p90 | 113 | 200 | 276 | 229 | |
| % ≤3 months | 89% | 45% | 7% | 51% | |
| Cardiology | n | 438 | 492 | 359 | 1,289 |
| Mean | 64 | 60 | 53 | 60 | |
| Median | 47 | 43 | 46 | 45 | |
| p90 | 126 | 114 | 96 | 112 | |
| % ≤3 months | 84% | 84% | 89% | 85% | |
| Dermatology | n | 1,261 | 1,546 | 1,412 | 4,219 |
| Mean | 62 | 46 | 39 | 48 | |
| Median | 53 | 33 | 27 | 36 | |
| p90 | 104 | 92 | 86 | 95 | |
| % ≤3 months | 83% | 90% | 91% | 88% | |
| Gastroenterology | n | 664 | 788 | 567 | 2,019 |
| Mean | 183 | 131 | 91 | 137 | |
| Median | 135 | 105 | 78 | 104 | |
| p90 | 419 | 271 | 178 | 279 | |
| % ≤3 months | 33% | 43% | 59% | 44% | |
| General Surgery | n | 1,151 | 1,300 | 934 | 3,385 |
| Mean | 101 | 71 | 57 | 77 | |
| Median | 64 | 56 | 49 | 55 | |
| p90 | 220 | 126 | 102 | 142 | |
| % ≤3 months | 64% | 80% | 87% | 77% | |
| Internal Medicine | n | 431 | 525 | 480 | 1,436 |
| Mean | 71 | 70 | 58 | 66 | |
| Median | 49 | 48 | 50 | 49 | |
| p90 | 151 | 149 | 118 | 133 | |
| % ≤3 months | 78% | 74% | 79% | 77% | |
| Neurosurgery | n | 28 | 56 | 23 | 107 |
| Mean | 175 | 158 | 79 | 146 | |
| Median | 114 | 108 | 68 | 98 | |
| p90 | 400 | 322 | 190 | 318 | |
| % ≤3 months | 43% | 43% | 70% | 49% | |
| Neurology | n | 567 | 692 | 531 | 1,790 |
| Mean | 73 | 93 | 97 | 88 | |
| Median | 71 | 85 | 97 | 81 | |
| p90 | 132 | 161 | 183 | 161 | |
| % ≤3 months | 68% | 53% | 49% | 57% | |
| Nephrology | n | 87 | 104 | 80 | 271 |
| Mean | 91 | 89 | 86 | 89 | |
| Median | 86 | 83 | 90 | 84 | |
| p90 | 147 | 138 | 135 | 138 | |
| % ≤3 months | 55% | 61% | 51% | 56% | |
| Obstetrics and Gynaecology | n | 1,044 | 1,304 | 1,010 | 3,358 |
| Mean | 106 | 92 | 77 | 92 | |
| Median | 82 | 69 | 63 | 69 | |
| p90 | 202 | 199 | 143 | 189 | |
| % ≤3 months | 55% | 66% | 74% | 65% | |
| Ophthalmology | n | 495 | 514 | 491 | 1,500 |
| Mean | 50 | 58 | 54 | 54 | |
| Median | 43 | 41 | 42 | 42 | |
| p90 | 99 | 109 | 116 | 107 | |
| % ≤3 months | 86% | 83% | 83% | 84% | |
| Orthopaedics | n | 1,046 | 912 | 385 | 2,343 |
| Mean | 122 | 150 | 116 | 132 | |
| Median | 91 | 138 | 106 | 108 | |
| p90 | 243 | 296 | 215 | 252 | |
| % ≤3 months | 50% | 33% | 42% | 42% | |
| Otolaryngology/ENT | n | 929 | 928 | 727 | 2,584 |
| Mean | 71 | 74 | 94 | 79 | |
| Median | 37 | 48 | 84 | 55 | |
| p90 | 155 | 155 | 188 | 163 | |
| % ≤3 months | 74% | 70% | 53% | 67% | |
| Paediatrics | N | 135 | 152 | 157 | 444 |
| Mean | 53 | 63 | 44 | 53 | |
| Median | 37 | 44 | 30 | 37 | |
| p90 | 120 | 118 | 91 | 108 | |
| % ≤3 months | 80% | 79% | 90% | 83% | |
| Physical Medicine & Rehab | n | 182 | 119 | 52 | 353 |
| Mean | 152 | 158 | 80 | 143 | |
| Median | 114 | 121 | 61 | 107 | |
| p90 | 344 | 335 | 146 | 319 | |
| % ≤3 months | 43% | 36% | 67% | 45% | |
| Plastic Surgery | n | 310 | 333 | 287 | 930 |
| Mean | 170 | 104 | 87 | 121 | |
| Median | 88 | 90 | 78 | 84 | |
| p90 | 442 | 208 | 155 | 274 | |
| % ≤3 months | 51% | 51% | 58% | 53% | |
| Psychiatry | n | 127 | 217 | 132 | 476 |
| Mean | 122 | 87 | 86 | 96 | |
| Median | 95 | 70 | 63 | 73 | |
| p90 | 206 | 191 | 168 | 198 | |
| % ≤3 months | 48% | 66% | 70% | 62% | |
| Respirology | n | 144 | 199 | 151 | 494 |
| Mean | 68 | 68 | 61 | 66 | |
| Median | 53 | 60 | 58 | 56 | |
| p90 | 111 | 103 | 98 | 101 | |
| % ≤3 months | 85% | 81% | 89% | 85% | |
| Rheumatology | n | 288 | 434 | 357 | 1,079 |
| Mean | 78 | 71 | 82 | 77 | |
| Median | 73 | 61 | 78 | 69 | |
| p90 | 148 | 123 | 136 | 138 | |
| % ≤3 months | 72% | 78% | 57% | 69% | |
| Specialty Clinics | n | 498 | 643 | 369 | 1,510 |
| Mean | 129 | 106 | 48 | 100 | |
| Median | 79 | 63 | 38 | 54 | |
| p90 | 334 | 302 | 90 | 276 | |
| % ≤3 months | 53% | 63% | 90% | 66% | |
| Urology | n | 455 | 658 | 579 | 1,692 |
| Mean | 81 | 100 | 98 | 94 | |
| Median | 57 | 96 | 83 | 76 | |
| p90 | 173 | 173 | 189 | 181 | |
| % ≤3 months | 75% | 49% | 55% | 58% | |
| Vascular Surgery | n | 54 | 63 | 47 | 164 |
| Mean | 112 | 138 | 73 | 110 | |
| Median | 90 | 140 | 52 | 90 | |
| p90 | 234 | 261 | 186 | 228 | |
| % ≤3 months | 52% | 37% | 70% | 51% | |
| Other Specialties | n | 257 | 307 | 265 | 829 |
| Mean | 89 | 88 | 53 | 77 | |
| Median | 57 | 50 | 37 | 46 | |
| p90 | 215 | 202 | 111 | 179 | |
| % ≤3 months | 64% | 67% | 84% | 72% | |
We used the 5% significance level and Stata MP 11.2 (StataCorp, College Station, Texas, USA) for data analyses.
This study and the Centralized Referral Program were approved by the North Edmonton PCN board of directors, which provides overall approval, oversight and accountability for all PCN programs, including their management, evaluation and research.
Results
In total, 33,281 referrals with an appointment date were included for analysis. Of these, 33% were received by the PCN in 2009, 38% in 2010 and 29% in 2011. The reduced number of referrals in 2011 may be explained by the exclusion of incomplete referrals (those still pending an appointment at year end). The number of referrals also varied greatly across the characteristics of patients and referrals, and across specialties. For example, the most frequent age group, sex, season and referral mode was "19–64," "female" (Table 1), "summer" and "letter" (Table 2), respectively. Re-referrals accounted for 10% of all referrals (Table 2). Regarding specialties, dermatology had the most (4,219 referrals, or 13%) and neurosurgery had the least (107 referrals, or 0.3%) number of referrals (Table 3).
| TABLE 1. Referral wait time (days) by year and characteristics of patients | |||||
| Year | |||||
| Measures | 2009 | 2010 | 2011 | Total | |
| All referrals | N | 10,919 | 12,742 | 9,620 | 33,281 |
| Mean | 96 | 88 | 73 | 86 | |
| Median | 63 | 63 | 56 | 61 | |
| p90 | 209 | 185 | 154 | 181 | |
| % ≤3 months | 66% | 66% | 71% | 67% | |
| Characteristics of patients | |||||
| Age groups | |||||
| 0–18 years old | n | 719 | 920 | 645 | 2,284 |
| Mean | 93 | 95 | 74 | 89 | |
| Median | 65 | 7 | 55 | 63 | |
| p90 | 181 | 202 | 168 | 87 | |
| % ≤3 months | 65% | 60% | 71% | 64% | |
| 9-64 years old | n | 7,834 | 9,097 | 6,864 | 23,795 |
| Mean | 99 | 88 | 75 | 88 | |
| Median | 67 | 64 | 57 | 63 | |
| p90 | 217 | 185 | 158 | 183 | |
| % ≤3 months | 65% | 66% | 70% | 67% | |
| 65+ years old | n | 2,366 | 2,725 | 2,111 | 7,202 |
| Mean | 87 | 84 | 67 | 80 | |
| Median | 55 | 57 | 51 | 55 | |
| p90 | 189 | 181 | 143 | 68 | |
| % ≤3 months | 71% | 69% | 75% | 71% | |
| Sex | |||||
| Male | n | 2,783 | 4,840 | 3,791 | 11,414 |
| Mean | 94 | 88 | 72 | 84 | |
| Median | 63 | 63 | 55 | 60 | |
| p90 | 202 | 187 | 153 | 174 | |
| % ≤3 months | 67% | 64% | 71% | 67% | |
| Female | n | 4,953 | 7,498 | 5,444 | 17,895 |
| Mean | 103 | 87 | 74 | 87 | |
| Median | 69 | 63 | 57 | 62 | |
| p90 | 227 | 185 | 156 | 184 | |
| % ≤3 months | 63% | 67% | 71% | 67% | |
| Unknown sex | n | 3,183 | 404 | 385 | 3,972 |
| Mean | 88 | 86 | 69 | 86 | |
| Median | 57 | 65 | 51 | 57 | |
| p90 | 185 | 169 | 144 | 180 | |
| % ≤3 months | 69% | 69% | 74% | 70% | |
| TABLE 2. Referral wait time (days) by year and characteristics of referrals | |||||
| Characteristics of referrals | Year | ||||
| Measures | 2009 | 2010 | 2011 | Total | |
| Season/months | |||||
| Spring (Feb-Apr) | n | 2,572 | 3,196 | 2,835 | 8,603 |
| Mean | 94 | 90 | 79 | 88 | |
| Median | 57 | 61 | 59 | 59 | |
| p90 | 209 | 199 | 174 | 192 | |
| % ≤3 months | 68% | 67% | 68% | 68% | |
| Summer (May-Jul) | n | 2,928 | 3,223 | 2,731 | 8,882 |
| Mean | 104 | 92 | 80 | 92 | |
| Median | 68 | 69 | 63 | 67 | |
| p91 | 229 | 192 | 162 | 189 | |
| % ≤3 months | 61% | 63% | 65% | 63% | |
| Fall (Aug-Oct) | n | 2,818 | 3,185 | 2,215 | 8,218 |
| Mean | 93 | 85 | 66 | 82 | |
| Median | 64.5 | 63 | 54 | 61 | |
| p92 | 189 | 181 | 129 | 166 | |
| % ≤3 months | 68% | 66% | 76% | 69% | |
| Winter (Nov-Jan) | n | 2,601 | 3,138 | 1,839 | 7,578 |
| Mean | 93 | 83 | 63 | 82 | |
| Median | 63 | 62 | 45 | 57 | |
| p93 | 205 | 165 | 141 | 168 | |
| % ≤3 months | 67% | 68% | 79% | 70% | |
| Modes of referrals | |||||
| Phone | n | 3,561 | 3,446 | 2,964 | 9,971 |
| Mean | 70 | 63 | 66 | 66 | |
| Median | 50 | 46 | 49 | 48 | |
| p90 | 134 | 127 | 149 | 138 | |
| % ≤3 months | 77% | 78% | 74% | 77% | |
| Letter | n | 7,114 | 8,991 | 6,583 | 22,688 |
| Mean | 109 | 97 | 76 | 95 | |
| Median | 71 | 71 | 58 | 67 | |
| p90 | 237 | 201 | 158 | 198 | |
| % ≤3 months | 61% | 61% | 70% | 64% | |
| Unknown mode | n | 244 | 305 | 73 | 622 |
| Mean | 105 | 80 | 74 | 89 | |
| Median | 77 | 48 | 68 | 62 | |
| p90 | 217 | 204 | 143 | 200 | |
| % ≤3 months | 56% | 68% | 66% | 63% | |
| Re-referrals | |||||
| No | n | 9,646 | 11,366 | 8,801 | 29,813 |
| Mean | 82 | 80 | 70 | 78 | |
| Median | 58 | 58 | 54 | 56 | |
| p90 | 170 | 165 | 148 | 161 | |
| % ≤3 months | 70% | 69% | 73% | 71% | |
| Yes | n | 1,273 | 1,376 | 819 | 3,468 |
| Mean | 203 | 150 | 106 | 159 | |
| Median | 145 | 118 | 90 | 118 | |
| p90 | 468 | 309 | 204 | 332 | |
| % ≤3 months | 31% | 38% | 51% | 38% | |
Tables 1, 2 and 3 show descriptive statistics of the wait time by year and by characteristics of patients, characteristics of referrals and specialties. For all referrals and years, the wait time mean, median and percentile 90% were 86 days, 61 days and 181 days, respectively. Referrals with a wait time of less than or equal to three months accounted for 67% of all referrals (Table 1).
The trend of wait times showed improvement over time. From 2009 to 2011, the mean decreased from 96 days to 73 days, median from 63 days to 56 days, percentile 90% from 209 days to 154 days and the percentage of referrals with a wait time of less than or equal to three months increased from 66% to 71% (Table 1). The trend of improvement seemed to be consistent among characteristics of patients and referrals, but varied greatly by specialties. For example, the generally positive trend was reversed in the specialties of allergy and clinical immunology, otolaryngology and rheumatology. Between 2009 and 2011 in allergy and clinical immunology, the mean increased from 79 days to 181 days, median from 48 days to 180 days, percentile 90% from 113 days to 276 days and the percentage of referrals with a wait time of less than or equal to three months decreased from 89% to 7%. The corresponding changes in otolaryngology were mean from 71 days to 94 days, median from 37 days to 84 days, percentile 90% from 155 days to 188 days and the percentage of referrals with a wait time of less than or equal to three months from 74% to 53%. In rheumatology, the trend was reversed for mean (from 78 days to 82 days), median (from 73 days to 78 days) and the percentage of referrals with a wait time of less than or equal to three months (from 72% to 57%), but percentile 90% dropped (from 148 days to 136 days) (Table 3 – available online at longwoods.com/content/23375).
Table 4 shows results from multiple regressions on the wait time. Controlling for characteristics of patients, referrals and specialties, the regressions show an improvement in the wait time over time. Compared to 2009, the mean (median; percentile 90%) of wait time was reduced by 11 days (2 days; 18 days) in 2010 and by 21 days (7 days; 27 days) in 2011. All the differences were statistically significant. The odd ratios of the logistic regression indicated that compared to 2009, the percentage of referrals with a wait time of less than or equal to three months increased by 6% in 2010 and by 23% in 2011. However, only the difference between 2009 and 2011 was significant.
| TABLE 4. Results from the multiple regressions on referral wait time | ||||||||
| Independent variables | Linear regression for mean | Quantile regression for median | Quantile regression for p90 | Logistic regression for % ≤ 3 months | ||||
| Coef. | p-value | Coef. | p-value | Coef. | p-value | OR | p-value | |
| 2009 for reference | ||||||||
| 2010 | -11 | 0.000 | -2 | 0.001 | -18 | 0.000 | 1.06 | 0.084 |
| 2011 | -21 | 0.000 | -7 | 0.000 | -27 | 0.000 | 1.23 | 0.000 |
| Male for reference | ||||||||
| Female | 2 | 0.048 | 1 | .036 | 4 | 0.035 | 0.99 | 0.615 |
| Sex unknown | -7 | 0.000 | -3 | 0.001 | -5 | 0.112 | 1.19 | 0.000 |
| Age group 19–64 for reference | ||||||||
| Age 0–18 | 12 | 0.000 | 12 | 0.000 | 16 | 0.000 | 0.66 | 0.000 |
| Age 65+ | -4 | 0.000 | -4 | 0.000 | -2 | 0.334 | 1.18 | 0.000 |
| Summer for reference | ||||||||
| Spring | -4 | 0.000 | -8 | 0.000 | -7 | 0.002 | 1.31 | 0.000 |
| Fall | -11 | 0.000 | -7 | 0.000 | -18 | 0.000 | 1.43 | 0.000 |
| Winter | -12 | 0.000 | -10 | 0.000 | -18 | 0.000 | 1.51 | 0.000 |
| One-time referrals for reference | ||||||||
| Re-referrals | 68 | 0.000 | 47 | 0.000 | 148 | 0.000 | 0.30 | 0.000 |
| Phone for reference | ||||||||
| Letter | 23 | 0.000 | 16 | 0.000 | 28 | 0.000 | 0.57 | 0.000 |
| Mode unknown | 18 | 0.000 | 11 | 0.000 | 29 | 0.000 | 0.56 | 0.000 |
| Paediatrics for reference | ||||||||
| Allergy & Clinical Immunology | 70 | 0.000 | 59 | 0.000 | 126 | 0.000 | 0.14 | 0.000 |
| Cardiology | 19 | 0.000 | 22 | 0.000 | 9 | 0.319 | 0.70 | 0.030 |
| Dermatology | 15 | 0.001 | 16 | 0.000 | 5 | 0.543 | 0.84 | 0.240 |
| Gastroenterology | 76 | 0.000 | 66 | 0.000 | 123 | 0.000 | 0.13 | 0.000 |
| General Surgery | 29 | 0.000 | 30 | 0.000 | 24 | 0.004 | 0.48 | 0.000 |
| Internal Medicine | 29 | 0.000 | 25 | 0.000 | 45 | 0.000 | 0.39 | 0.000 |
| Neurosurgery | 87 | 0.000 | 67 | 0.000 | 148 | 0.000 | 0.16 | 0.000 |
| Neurology | 52 | 0.000 | 56 | 0.000 | 75 | 0.000 | 0.14 | 0.000 |
| Nephrology | 46 | 0.000 | 60 | 0.000 | 34 | 0.005 | 0.16 | 0.000 |
| Obstetrics & Gynaecology | 45 | 0.000 | 42 | 0.000 | 72 | 0.000 | 0.26 | 0.000 |
| Ophthalmology | 22 | 0.000 | 23 | 0.000 | 18 | 0.043 | 0.55 | 0.000 |
| Orthopaedics | 77 | 0.000 | 76 | 0.000 | 118 | 0.000 | 0.11 | 0.000 |
| Otolaryngology/ENT | 32 | 0.000 | 27 | 0.000 | 48 | 0.000 | 0.28 | 0.000 |
| Physical Medicine & Rehab | 88 | 0.000 | 71 | 0.000 | 180 | 0.000 | 0.12 | 0.000 |
| Plastic Surgery | 87 | 0.000 | 66 | 0.000 | 160 | 0.000 | 0.11 | 0.000 |
| Psychiatry | 44 | 0.000 | 40 | 0.000 | 70 | 0.000 | 0.27 | 0.000 |
| Respirology | 22 | 0.000 | 31 | 0.000 | -2 | 0.849 | 0.76 | 0.147 |
| Rheumatology | 35 | 0.000 | 44 | 0.000 | 33 | 0.000 | 0.29 | 0.000 |
| Specialty Clinics | 55 | 0.000 | 29 | 0.000 | 139 | 0.000 | 0.26 | 0.000 |
| Urology | 66 | 0.000 | 62 | 0.000 | 100 | 0.000 | 0.12 | 0.000 |
| Vascular Surgery | 68 | 0.000 | 66 | 0.000 | 112 | 0.000 | 0.13 | 0.000 |
| Other Specialties | 29 | 0.000 | 18 | 0.000 | 45 | 0.000 | 0.40 | 0.000 |
Regarding patient characteristics, there was a significant difference in wait time between men and women. However, the "unknown sex" group, which accounted for 12% of the sample, may bias this association. Compared to patients aged 19–64 years, patients aged 18 years or younger (referred to all specialties) had a significantly longer wait time, while patients aged 65 years or older had a significantly shorter wait time.
On average, referrals in summer had 4 days', 11 days' and 12 days' longer wait time than those in spring, fall and winter, respectively. This variance is likely explained by the summer vacation season.
Patients who needed to be re-referred waited 68 days longer than those whose initial referrals were accepted. Patients referred to specialists who required letters before an appointment could be made had to wait 23 days longer than those whose doctors accepted appointments over the telephone. These patterns held true for median and percentile 90% of the wait time and true for the percentage of referrals with a wait time of less than or equal to three months. All the differences were statistically significant.
The wait time varied substantially among specialties. Compared to paediatrics, the shortest wait time mean specialty (of note, only 54% of children aged 18 years or younger were referred to paediatricians), all other specialties had a significantly longer wait time and a significantly lower percentage of referrals with a wait time of less than or equal to three months. The exceptions were cardiology, dermatology and respirology for percentile 90%, and dermatology and respirology for the percentage.
Discussion
The main finding of this study is the trend of improvement in referral wait time from 2009 to 2011 at the Edmonton North PCN. It is possible that the Centralized Referral Program – by tracking and maintaining specialist data, striving to ensure referrals are accepted the first time and referring patients to specialists with shorter wait lists – has had a positive impact. However, this attribution is weakened by the absence of control data. During the study time period, some specialties in Edmonton implemented a number of strategies and activities to reduce their wait times (Alberta Health Services 2010, 2011), and it is possible these also had a positive impact on the wait time. In order to confirm whether the Centralized Referral Program has had a positive impact on wait times, control data are required.
In terms of related data, Alberta has a wait time registry where Albertans interested in treatment options can view wait time information (including trends over time) on medical procedures and diagnostic tests and then discuss their choices with their healthcare provider (Alberta Health and Wellness and Alberta Health Services 2012). However, the registry defines wait time as the interval between a patient's or specialist's decision that a procedure or test is required and the date the procedure or test is performed. Because this is different from the definition in the current study, outcomes cannot be directly compared. Another source of data showing the trend over time of referral wait times is the series of reports titled Waiting Your Turn: Wait Times for Health Care in Canada by the Fraser Institute (Barua et al. 2010, 2011). By surveying practitioners of 12 specialties, the reports show that the median referral wait times in Alberta in 2009, 2010 and 2011 were 10.0, 9.9 and 10.7 weeks, respectively. Compared to this self-reported trend, our results favour the Centralized Referral Program.
Several findings from this study have policy implications. First, the referral wait time and its trend over time vary substantially by specialty. More investigation is warranted to understand these differences and resolve any bottlenecks, especially for specialties with a long wait time and those with the reverse trend. Second, patients have to wait for more than two months longer if they need to be re-referred, suggesting that efforts to improve referral appropriateness, such as those attempted through the Centralized Referral Program, are warranted. Third, patients have to wait considerably longer if a specialist requires a letter of referral before a booking is made rather than making an appointment over the telephone (with a letter to follow). Simply eliminating this one step in the booking process could result in reducing wait times by over three weeks.
A limitation regarding the data that needs to be acknowledged is that, as the data were extracted in early January 2012, the referrals received by Edmonton North PCN in late 2011, or referrals in 2011 that needed a long time to receive an appointment date, were not included in the analysis (that is, only completed referrals were included). Such exclusions may bias the wait time results in 2011. However, the wait time improvement from 2009 to 2010 is unlikely to be biased. One may also argue that the wait time improvement between 2009 and 2011 is due to the reduction in the volume of referrals. However, this seems unlikely as there was also an improvement of the wait time between 2009 and 2010, when the volume increased. Finally, the wait time from the date on which a FP sees the patient and issues a referral to the date on which the PCN receives the referral was not available for this analysis.
In conclusion, this study demonstrates the potential value in tracking referral information from primary to specialty care. While there is not enough evidence to attribute the improvements directly to the Centralized Referral Program, the study findings are encouraging and further investigation, preferably through a controlled study, is recommended. Referral wait time from primary to specialty care is an immensely complex issue, and substantive improvement will likely require focused system-level attention. However, this study suggests that change is possible and that further improvements can be made.
Temps d'attente entre les services de première ligne et les soins d'un spécialiste : analyse de la tendance à Edmonton, Canada
Résumé
Les temps d'attente pour les services médicaux constituent un des principaux enjeux de politique de santé au Canada. Il y a peu de données fiables sur le temps d'attente entre les services de première ligne et l'aiguillage vers les soins d'un spécialiste. Les données sur ces temps d'attente sont généralement signalées par les spécialistes eux-mêmes. En 2008, le réseau Edmonton North Primary Care Network (PCN) a mis au point un programme centralisé d'aiguillage, doté d'une base de données spécialisée qui contient des renseignements sur les conditions, les formulaires et les protocoles d'aiguillage vers les spécialistes. Cette base de données permet d'assurer le suivi des aiguillages que le PCN fait au nom des médecins de famille vers les soins de spécialistes. Nous avons effectué une analyse de la tendance des temps d'attente pour l'aiguillage (défini comme étant le temps entre la recommandation de la part du médecin de famille et la date de rendez-vous chez le spécialiste), de 2009 à 2011, à l'aide de la base de données du programme (n=33 281 aiguillages). L'étude brosse un portrait unique et complet des temps d'attente pour 22 spécialités. Nous avons observé un déclin, d'année en année, du temps général d'attente ainsi qu'une amélioration du nombre d'aiguillages qui sont acceptés dès la première fois. De plus, nous avons dégagé des occasions précises pour améliorer davantage le temps d'attente pour les aiguillages.
About the Author(s)
Nguyen X. Thanh, MD, PhD, MPH, Adjunct Associate Professor, Department of Public Health Sciences, University of Alberta, Health Economist, Institute of Health Economics, Edmonton, AB
Margaret Wanke, MHSA, President and CEO, Charis Management Consulting, Edmonton, AB
Leanne McGeachy, MBA, General Manager, Edmonton North Primary Care Network, Edmonton, AB
Correspondence may be directed to: Nguyen Xuan Thanh, MD, PhD, MPH, Institute of Health Economics, 1200 – 10405 Jasper Ave., Edmonton, AB T5J 3N4; tel.: 780-448-4881; fax: 780-4480018; e-mail: tnguyen@ihe.ca.
Acknowledgment
We would like to thank Lindsay Steward, Physician Administrative Services Manager, and Carly Strong, Executive Assistant at the Edmonton North PCN, for their input and assistance, as well as Nate Schmold and Katherine Thielmann, data management specialists at Lexi.net, for extracting the data.
Funding from the Edmonton North PCN for this independent, external study is gratefully acknowledged.
References
Alberta Health Services. 2011. 2011–2015 Health Plan. Retrieved April 13, 2013. <http://www.albertahealthservices.ca/Publications/ahs-pub-2011-2015-health-plan.pdf>.
Alberta Health and Wellness and Alberta Health Services. 2012. "Alberta Wait Times Reporting, Wait Time Trends." Retrieved April 13, 2013. <http://waittimes.alberta.ca/>.
Barua, B., M. Rovere and B.J. Skinner. 2010. Waiting Your Turn: Wait Times for Health Care in Canada (20th ed.). Retrieved April 13, 2013. <http://www.fraserinstitute.org/uploadedFiles/fraser-ca/Content/research-news/research/publications/waiting-your-turn-2010.pdf>.
Barua, B., M. Rovere and B.J. Skinner. 2011. Waiting Your Turn: Wait Times for Health Care in Canada (21st ed.). Retrieved April 13, 2013. <http://www.fraserinstitute.org/uploadedFiles/fraser-ca/Content/research-news/research/publications/waiting-your-turn-2011.pdf>.
Carrière, G. and C. Sanmartin. 2010. "Waiting Time for Medical Specialist Consultations in Canada, 2007." Health Reports 21(2): 1–8. Statistics Canada Catalogue no. 82-003-XPE.
Government of Alberta and Alberta Health Services. 2010. "Becoming the Best: Alberta's 5-Year Health Action Plan 2010–2015." Retrieved April 13, 2013. <http://www.health.alberta.ca/documents/Becoming-the-Best-2010.pdf>.
Hao, L. and D.Q. Naiman. 2007. Quantile Regression. Quantitative Applications in the Social Sciences Series 149. Thousand Oaks, CA: Sage Publications.
Primary Care Initiative. 2012. "About PCNs." Retrieved April 13, 2013. <http://www.albertapci.ca/AboutPCNs/Pages/default.aspx>.
Comments
Be the first to comment on this!
Personal Subscriber? Sign In
Related Articles

Note: Please enter a display name. Your email address will not be publically displayed